19 Remote Sensing Applications
Describe practical uses of remote sensing in environmental studies
Explain how hyperspectral and thermal remote sensing data are used
Evaluate the strengths and limitations of remote sensing for various applications
Since the launch of the first artificial satellite, Sputnik 1, in 1957, humans have continuously advanced their ability to observe the Earth from space. During this time, remote sensing technologies have evolved from simple cameras and early multispectral sensors focused on visible and infrared wavelengths to more sophisticated instruments that capture data across a broader range of the electromagnetic spectrum, including thermal infrared and microwave (radio) regions. At the same time, sensing systems have progressed from passive sensors that rely on nature energy source to active sensors that generate their own signals. Examples include Light Detection and Ranging (LiDAR) and Radio Detection and Ranging (RADAR), which enable data collection regardless of lighting or weather conditions. In this chapter, we will discuss applications of a few remote sensing technologies that have been greatly improved our ability to understand the Earth surface, including imaging spectroscopy, thermal imaging and LiDAR.
19.1 Imaging spectroscopy
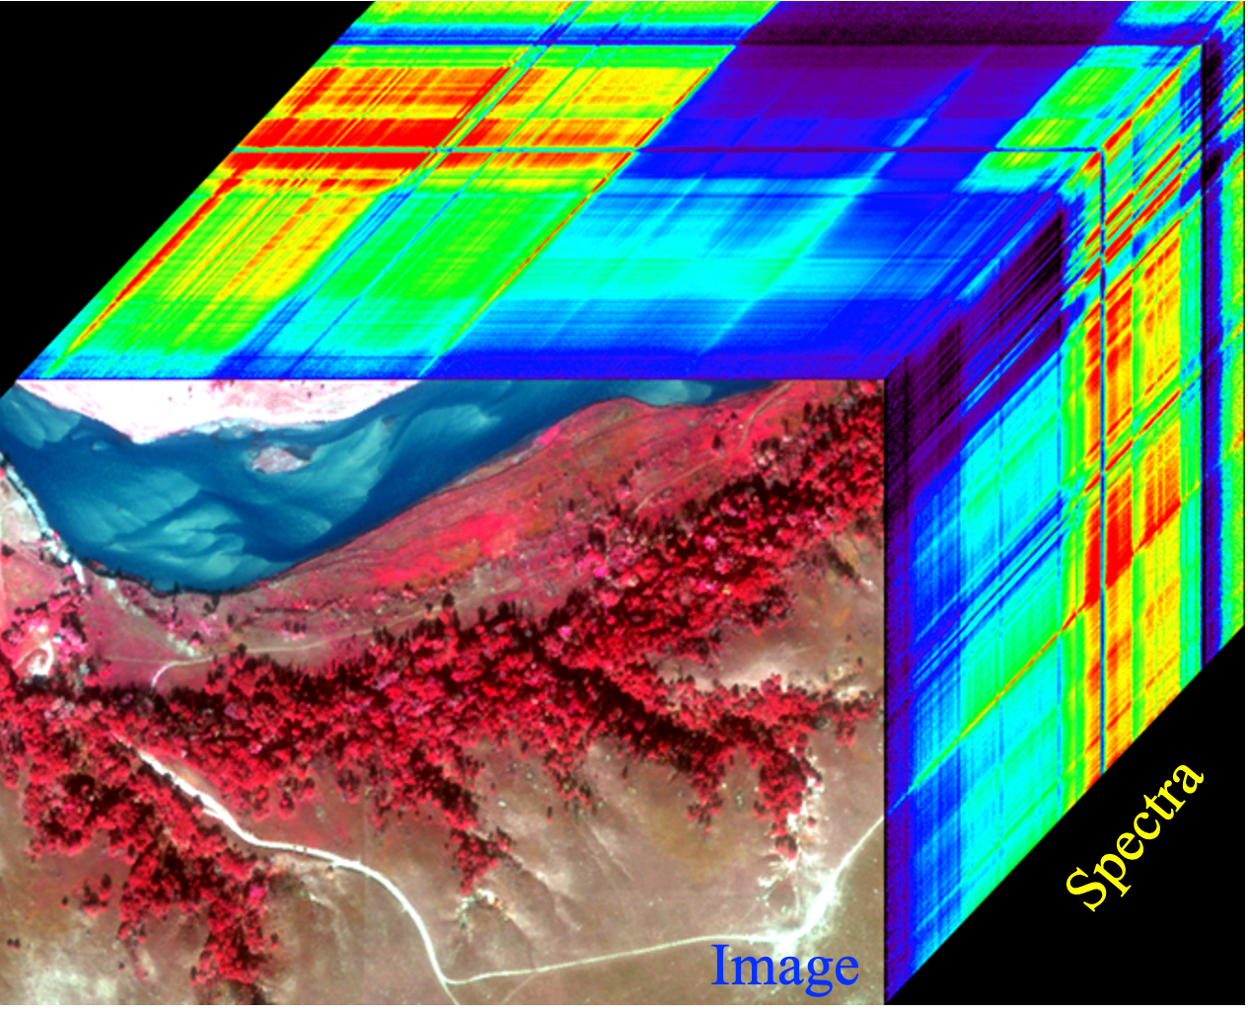
Imaging spectroscopy, also called hyperspectral imaging or ultraspectral imaging, refers to the technology that simultaneously obtain spatially co-registered images in many (e.g., hundreds) narrow, spectrally continuous bands from a remotely operated platform (Schaepamn, et al. 2009). Unlike multispectral imagery, which measures reflectance in a limited number of broad bands, hyperspectral data capture continuous spectral information across a wide portion of the electromagnetic spectrum. As a result, each pixel contains a detailed spectrum that describes how the surface reflects or emits energy at many closely spaced wavelengths Figure 19.1.
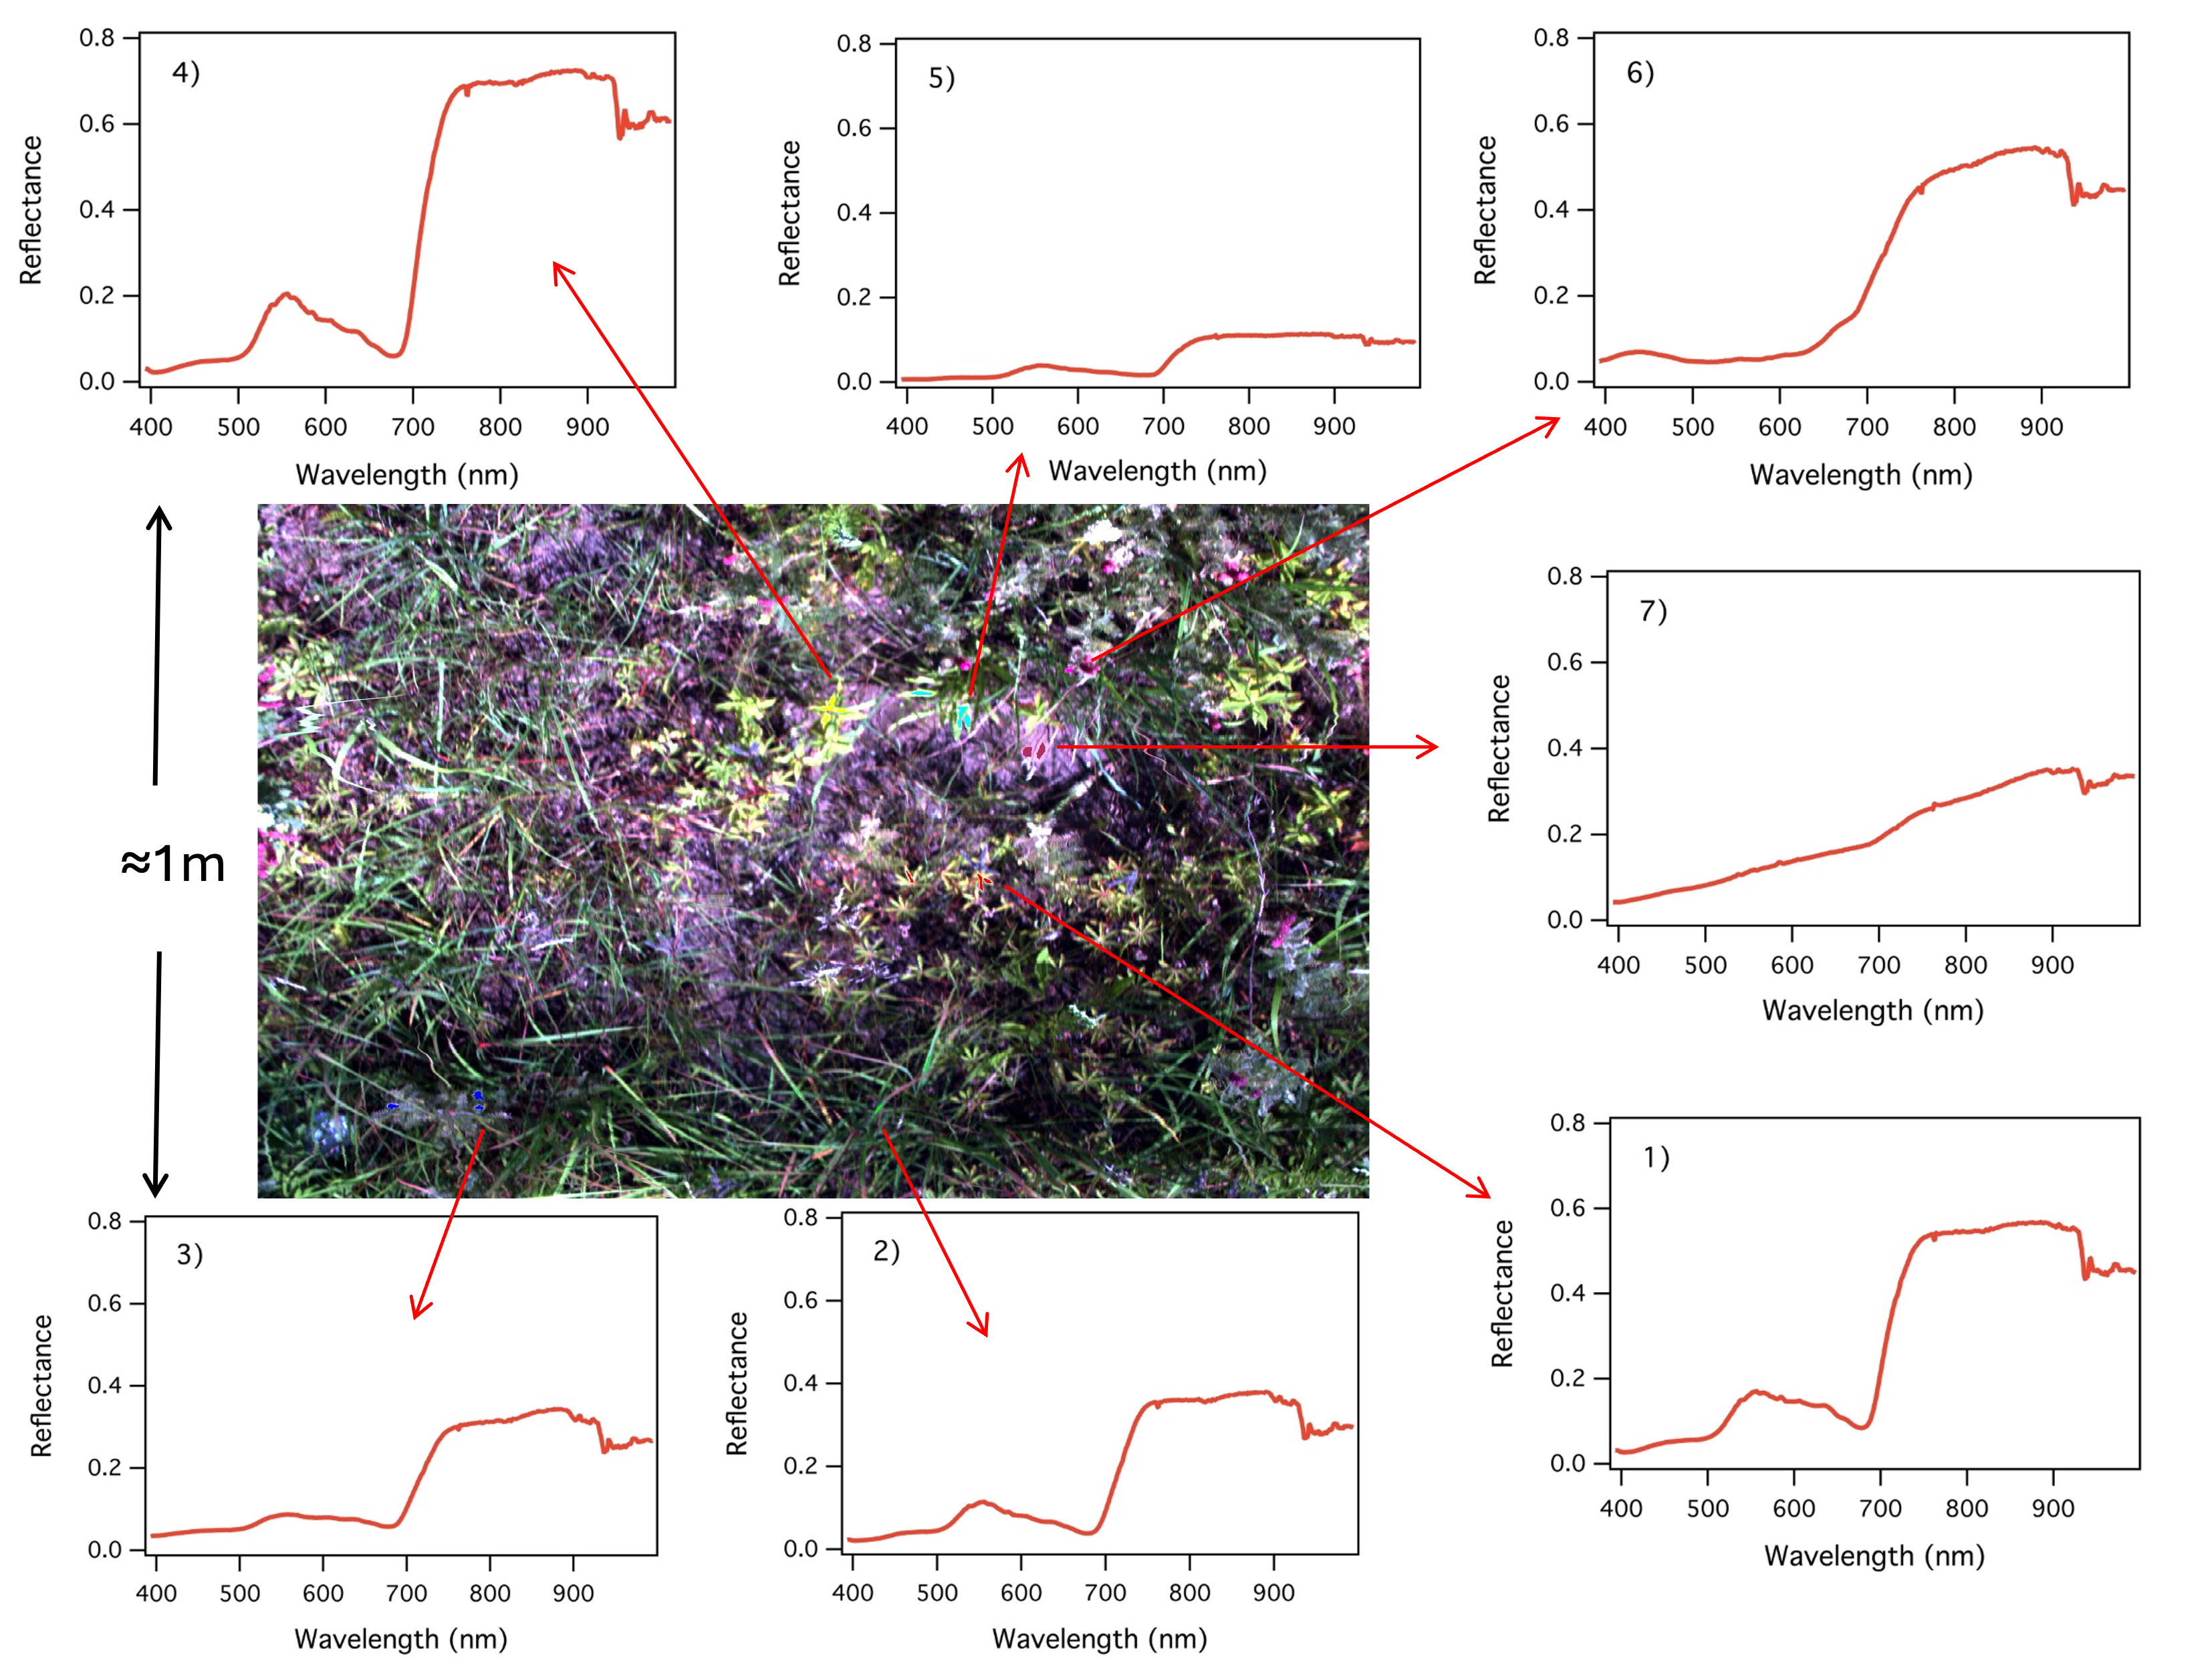
This rich spectral information allows us to distinguish between targets that may look similar in traditional imagery. For example, different vegetation species, soil types, or minerals can be identified based on subtle differences in their spectral signatures. For example, even prairie species and backgrounds can be identified using hyperspectral imagery captured from a ground platform Figure 19.2. Obtained from airborne and the emerging satellite systems (such as PRISMA, EMIT, and EnMAP), hyperspectral data are therefore especially useful for applications such as vegetation analysis, mineral mapping, water quality assessment, and environmental monitoring.
19.2 Thermal imaging
Thermal remote sensing measures energy in the thermal infrared region (approximately 3 – 14 µm) that is being emitted from Earth’s surface, rather than reflected sunlight. Unlike visible and near-infrared remote sensing, which depend on reflected solar radiation, thermal remote sensing detects emitted radiation from objects based on their temperature. Any object above absolute zero (0 K, −273.15 °C, −459.67 °F) emits electromagnetic energy, and the amount and wavelength of this energy depend on its temperature. This behavior is described by fundamental principles of thermal physics Figure 19.3.
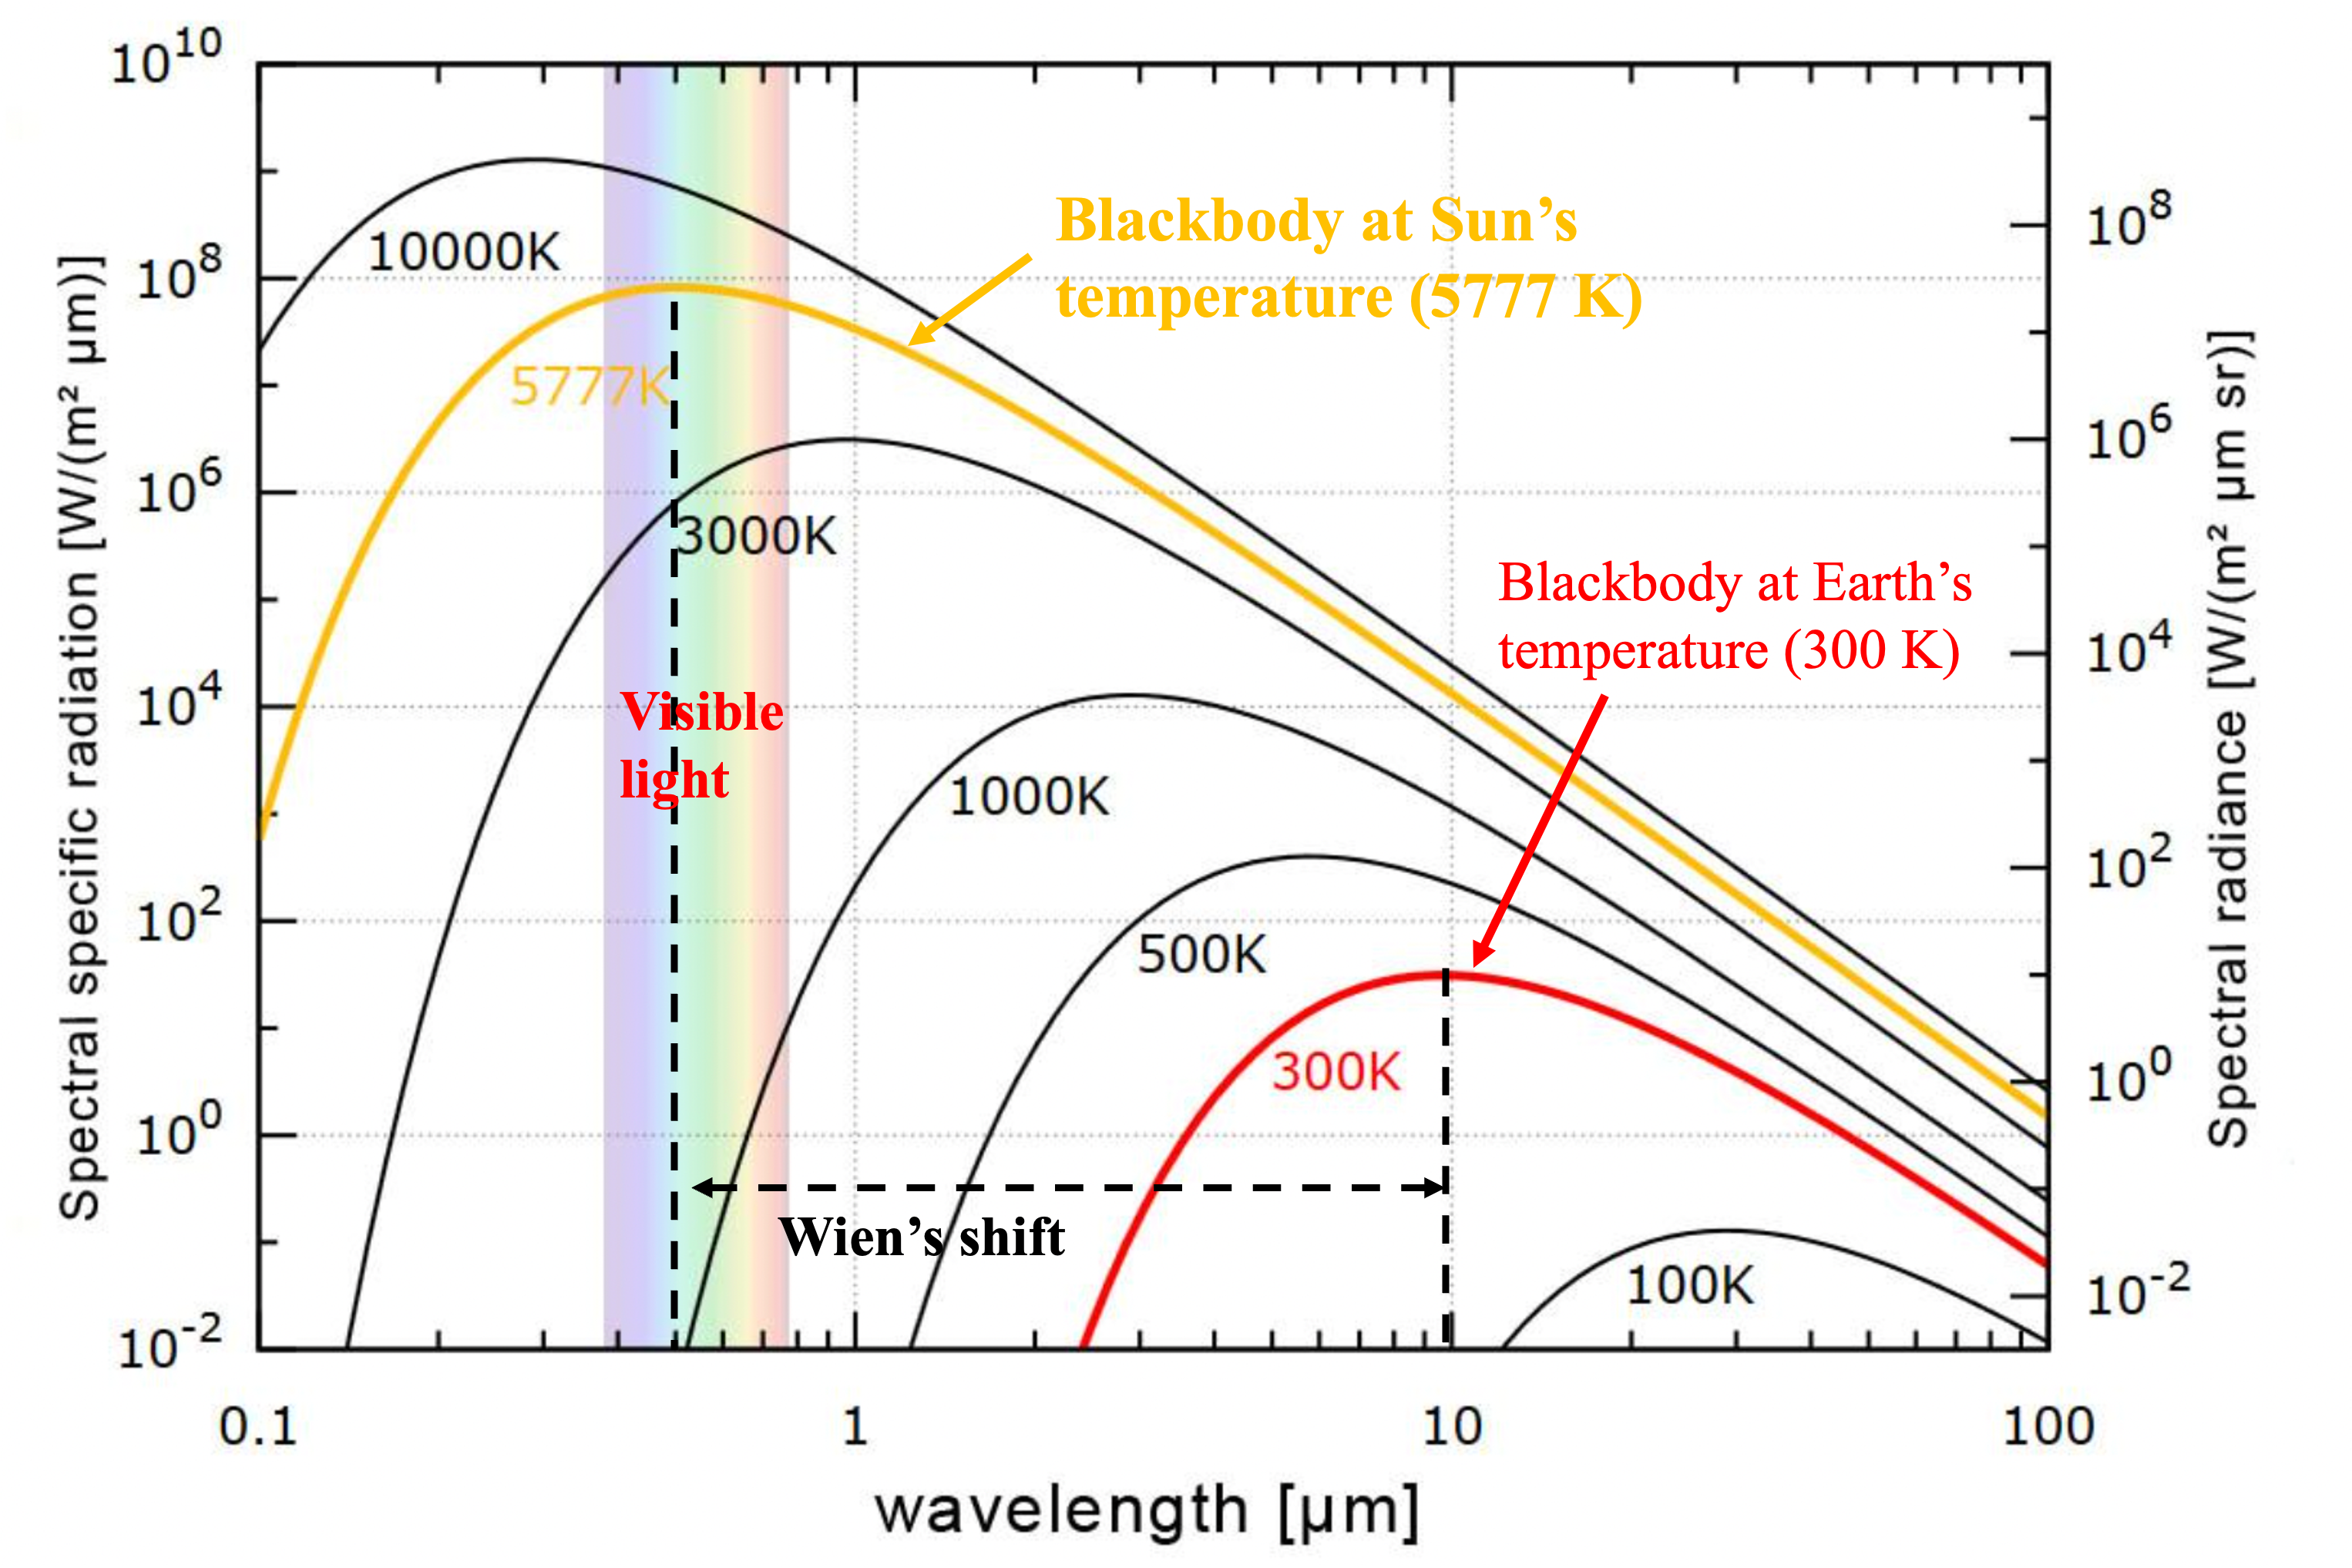
A blackbody is a hypothetical, ideal radiator that completely absorbs and re-emits all incident energy. The total amount of energy emitted by an object, as well as the spectral distribution of that energy (its radiation curve), depends on its temperature.
Planck’s radiation law: Electromagnetic radiation emitted from a blackbody at a certain wavelength is a function of its absolute temperature.
Stefan-Boltzmann law: The higher the temperature of the radiator, the greater the total amount of radiation it emits.
Wien’s displacement law: with increasing temperature, wavelength of maximum spectral radiant exitance shifts to shorter wavelengths.
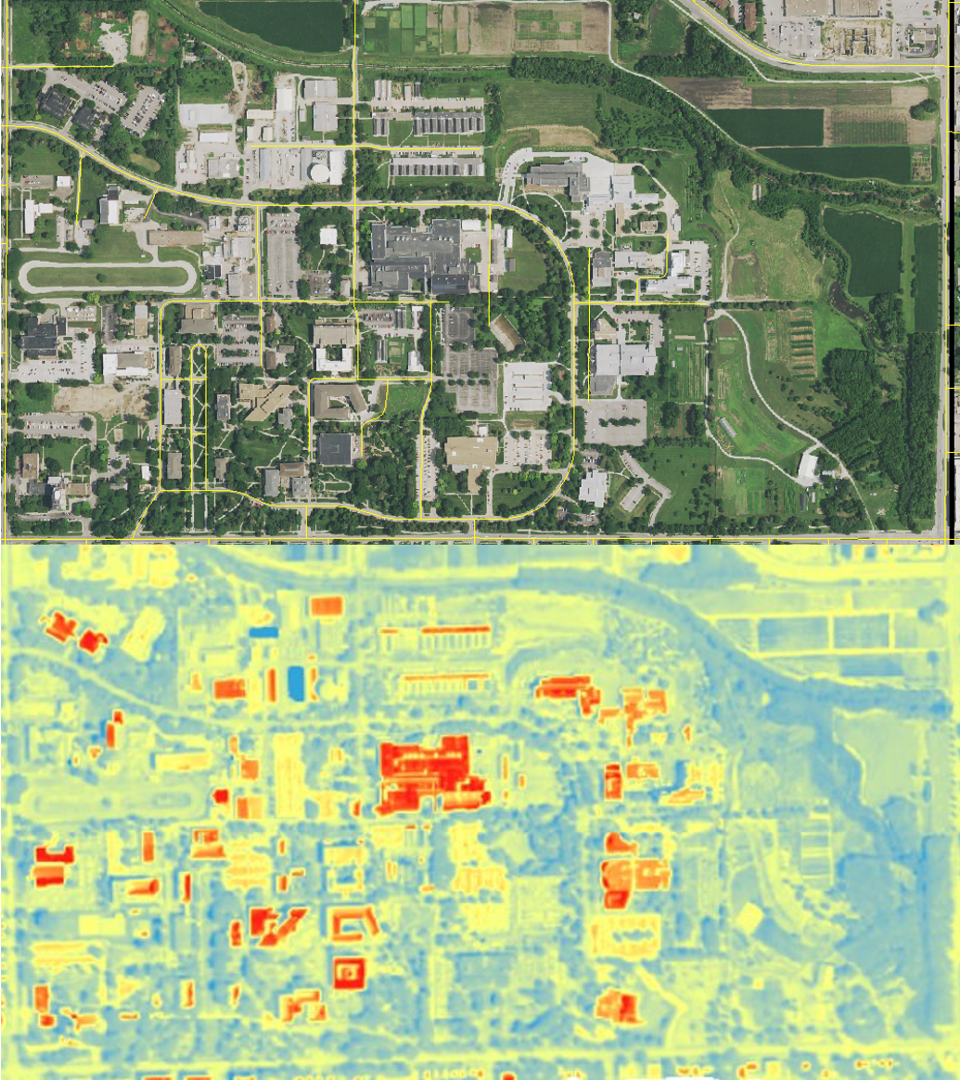
Thermal remote sensing has a wide range of practical applications because surface temperature reflects underlying physical processes. For example, it is commonly used to identify urban heat islands, detect crop water stress in agriculture, monitor water temperature in lakes and rivers, and map active wildfires. For example, airborne thermal remote sensing was able to capture variations in temperature across different targets on UNL East campus. Vegetated areas generally exhibited lower temperatures than impervious surfaces such as roads and buildings. Interestingly, building temperatures also varied depending on rooftop color and construction materials Figure 19.4. These differences reflect how surface properties, such as albedo and thermal characteristics, influence heat absorption and emission. Overall, these results clearly demonstrate the urban heat island effect, where built-up areas retain more heat than surrounding vegetated regions. They also provide useful insights for mitigation strategies, such as increasing urban vegetation and using reflective or high-emissivity roofing materials to reduce surface temperatures.
19.3 Light Detection and Ranging (LiDAR)
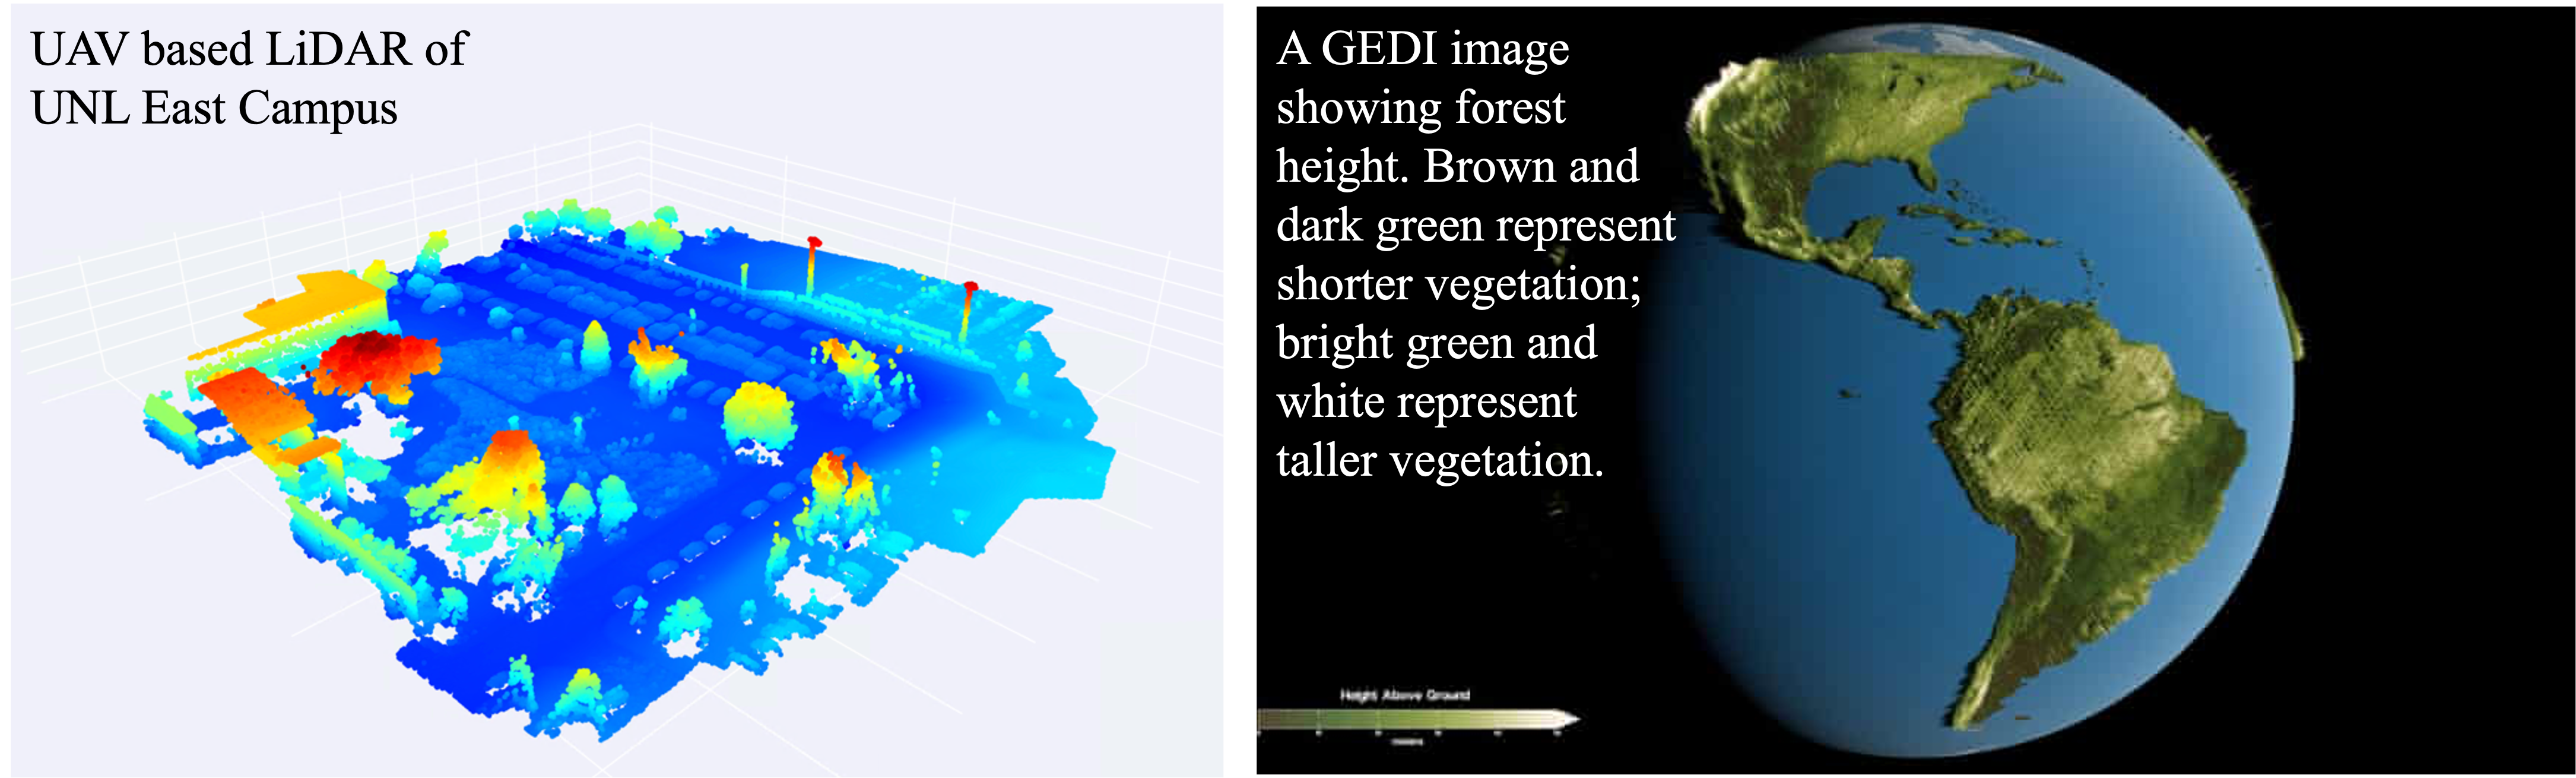
LiDAR is an active remote sensing technology that measures distance by emitting short pulses of laser light toward the Earth’s surface. When a pulse hits an object, such as the ground, vegetation, or buildings, part of the energy is reflected back to the sensor. The system records the time it takes for the light to travel to the target and return. Using this travel time (t) and the speed of light (c ≈ 3 ×10⁸ m/s), the distance to the object can be calculated (c∙t/2). By collecting millions of these measurements, LiDAR systems generate highly accurate 3D representations of the Earth’s surface, including elevation and surface structure Figure 19.5.
In summary, these modern remote sensing technologies can provide unique and complementary information about Earth’s surface, enhancing our ability to analyze and understand it from multiple dimensions.
19.4 References
Schaepman ME, Ustin SL, Plaza AJ, Painter TH, Verrelst J, Liang S. Earth system science related imaging spectroscopy-An assessment. Remote Sensing of Environment. 2009;113: S123-S37.
Wang R, Gamon JA, Cavender-Bares J, Townsend PA, Zygielbaum AI. The spatial sensitivity of the spectral diversity-biodiversity relationship: an experimental test in a prairie grassland. Ecological Applications. 2018;28(2):541-56.